How Charts Work chapter 15
“Titles and text attract people’s attention, are dwelled upon during encoding, and correspondingly contribute to recognition and recall. People spend the most amount of time looking at the text in a visualisation, and more specifically, the title.” by Michelle Borkin - Beyond Memorability: Visualization Recognition an Recall (2015)
Smith, Alan. How Charts Work (p. 240). Pearson Education. Kindle Edition.
So, text – particularly narrative text – is what transforms the role of charts from “Here are some numbers” (which you likely won’t remember) to “Here’s a story” (that you probably will).
Smith, Alan. How Charts Work (p. 240). Pearson Education. Kindle Edition.
- Chart Title as a “microstory” - meaningful, succinct and memorable. And its also self-sufficient. (p 241)
The Financial Times Recipe for text in charts
(p 241)
Chart Title
- The title should be the first element you create in the chart-making process (p 242)
- In most situations at the FT, we strive for narrative chart titles that promote memorability and meaningfulness. Smith, Alan. How Charts Work (p. 242). Pearson Education. Kindle Edition.
- What makes a good chart title:
- Keywords: How…, Why…(p 243)
- Active verbs (p 244)
- Appropriate verbs (p 245)
- Avoid puns and wordplay (p 246)
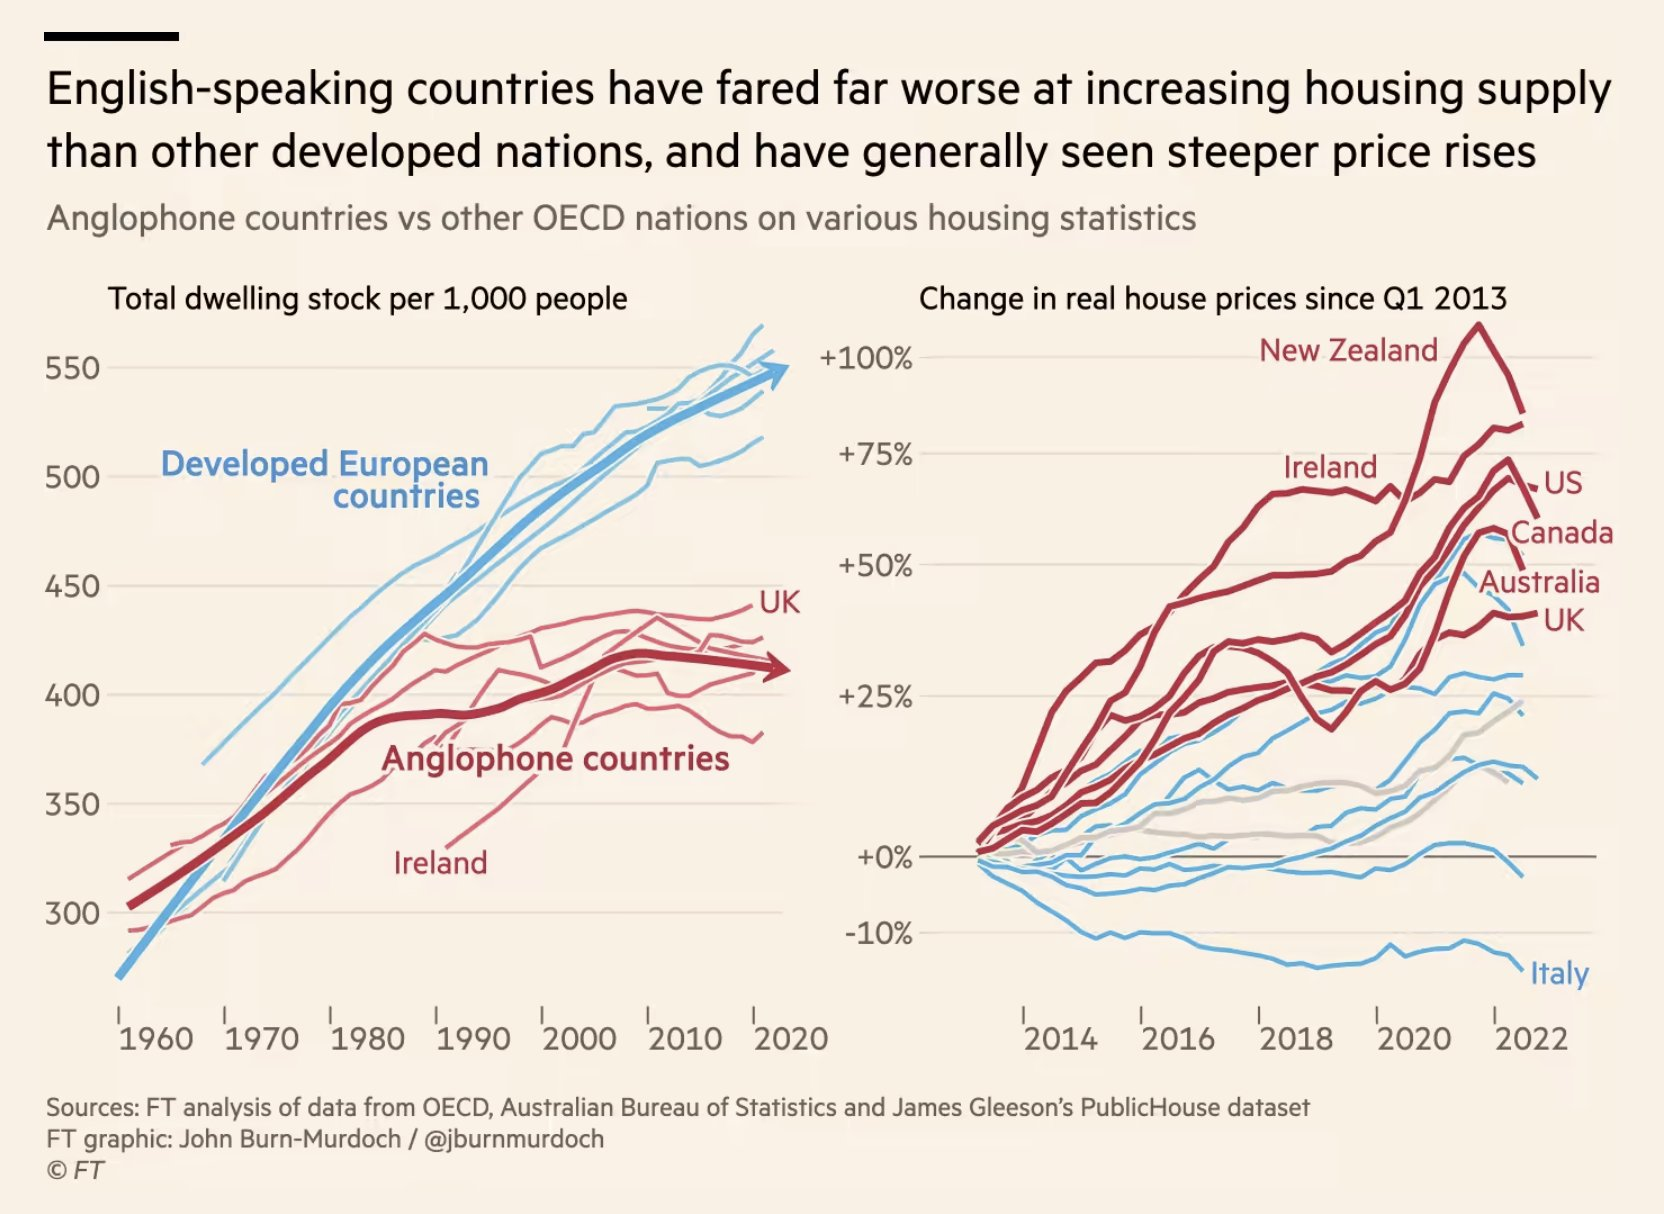
Titles can be made to work even harder, by using colour to highlight key information we should look out for in the chart.
- Smith, Alan. How Charts Work (p. 245). Pearson Education. Kindle Edition.
Chart Subtitle
For Metadata (p 247)
Use the title and subtitle as a combo to provide a call to look (the title) followed by a show and tell (subtitle and chart).
- Smith, Alan. How Charts Work (p. 247). Pearson Education. Kindle Edition.
Footnote
Legend
Annotation
Annotations contextualise data and help readers to understand key information about the patterns on a chart. Smith, Alan. How Charts Work (p. 249). Pearson Education. Kindle Edition.
- Keep an annotation brief (p 250)
- Make it clear which elements on the chart each annotation refers (p 250)
Chart from: https://www.ft.com/content/dca3f034-bfe8-4f21-bcdc-2b274053f0b5