CIE International Commission on Illumination, in French Commission internationale de l’éclairage (wiki)
CIE is an organisation that creates standards related to light and colour.
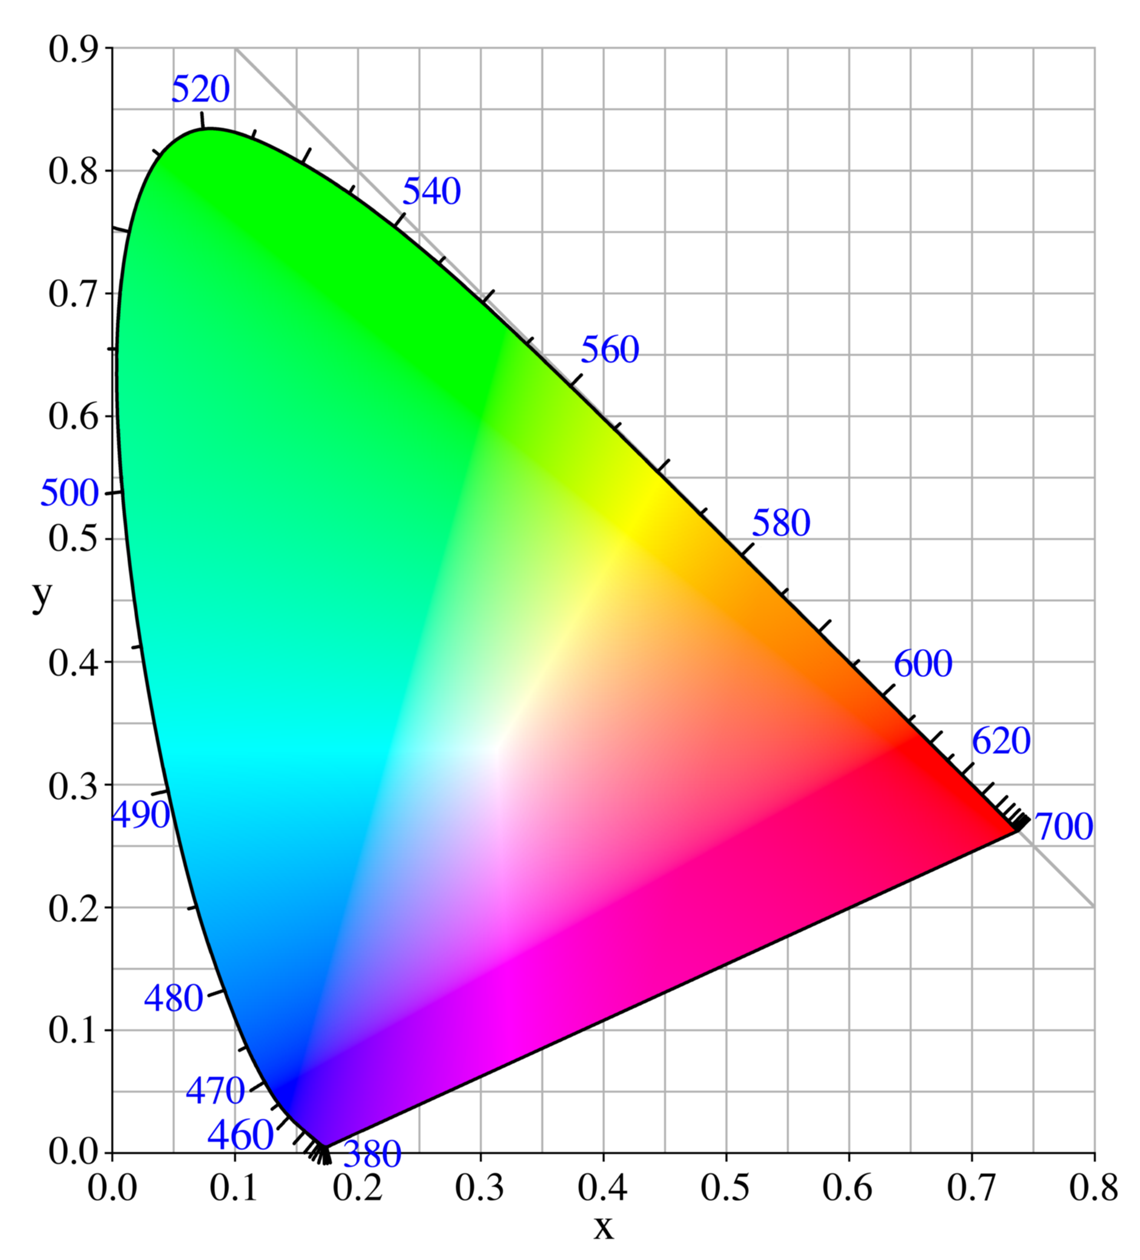
CIE 1931 colour space (aka CIE XYZ colour space) — This diagram is called chromaticity diagram.
The CIE chromaticity diagram shows the different colours parametrised by normalised coordinates x and y, for one particular brightness value. (ie brightness information not included in this diagram).
CIE XYZ and CIE RGB can be converted back and forth - ‘Linear Transformation’.
Related to: CIE XYZ standard observer colour matching function
References
-
https://medium.com/hipster-color-science/a-beginners-guide-to-colorimetry-401f1830b65a
- Keep in mind that XYZ and RGB are different transformations of the same data, anything you can do with one you can do with the other, and colours can be converted back and forth between them.
-
https://en.wikipedia.org/wiki/Color_space
- CIE 1931 XYZ colour space was one of the first attempts to produce a colour space based on measurements of human colour perception. The CIERGB colour space is a linearly-related companion of CIE XYZ. Additional derivatives of CIE XYZ include the CIELUV, CIEUVW, and CIELAB.
-
https://en.wikipedia.org/wiki/Color_model
- One of the first mathematically defined colour spaces is the CIE XYZ colour space (also known as CIE 1931 colour space)
-
https://www.rp-photonics.com/chromaticity.html
-
In many technical applications, perceivable colours are represented by coordinates in some colours space. Usually, such a space has three dimensions, corresponding to the three different kinds of colour receptors used for photopic vision of the human eye. Frequently, one takes one of those dimensions to correspond to the luminance, determining the perceived brightness. The remaining two dimensions are then interpreted as the chromaticity, defined through two coordinate values. The meaning of those coordinates can be very different, depending on the used colour space. For example, chromaticity may further be divided into hue (“type of colour”) and colour saturation.
-
For example, there is the widely used CIE chromaticity diagram with normalised coordinates
xandy, calculated from the XYZ values of CIE XYZ colour space. One may consider the shown two-dimensional colour distribution as one plane (for one particular brightness) of the three-dimensional colour space.
-