- Fonts, colours and shapes make data visualisations visual and memorable. (8:17)
Outline
- Why have a style guide?
- What should be included in a style guide?
- How to develop a style guide
- Example
Why have a style guide?
- make styles consistent A design system is about being consistency
- make it easier for all staff to implement
What should style guide include?
- Most common elements included in style guides
- Chart parts (+ tables)
- Typography
- Colour Palette
- Chart design
- Should also be included
- Resource list
- Template and Exporting options
- eg theme, library
- Diversity, Equity, Inclusion
- Accessibility and Alt text rule
Define every parts: line, font family, font size, colour, etc
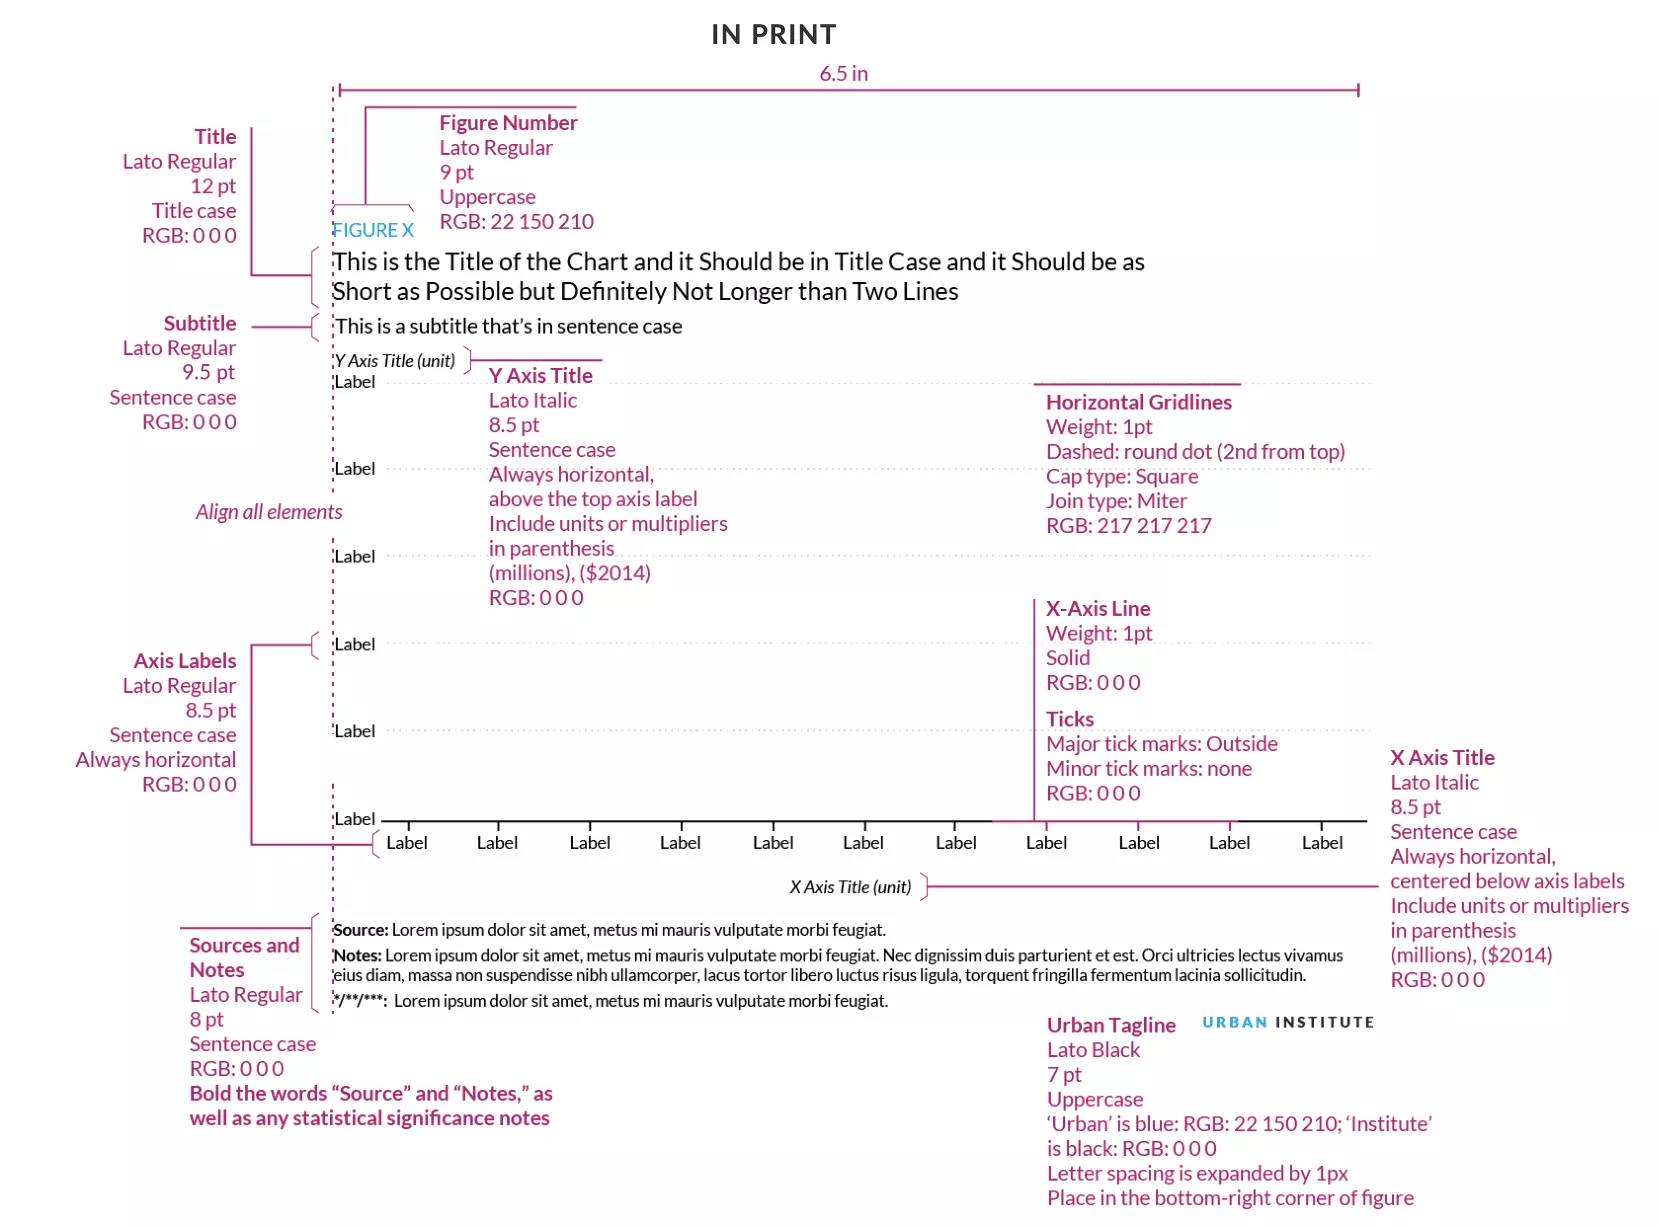
Typography
The other thing we can do in a style guide is to give instruction and direction to teams.
- Why it is important?
- How to do it?
Also consider numbers when choosing fonts - tabular numerals aka monospaced numerals
Colours
- Branded colours are not necessarily going to work on data visualisation
- branded colours can make charts feel very dark/bright
Chart Design
- London Style Guide
- make chart looks consistent: A design system is about being consistency
Accessibility is not just colour vision
- internet speed
- device
- Alt text
Alt text template(24:40): ”chart type of type of data where reason for including chart”
How to develop style guide?
2 part
- get input from all sides
- treat a style guide as a living document
Get input from all sides: designer, analysis, PR, media, data scientist etc — different platform
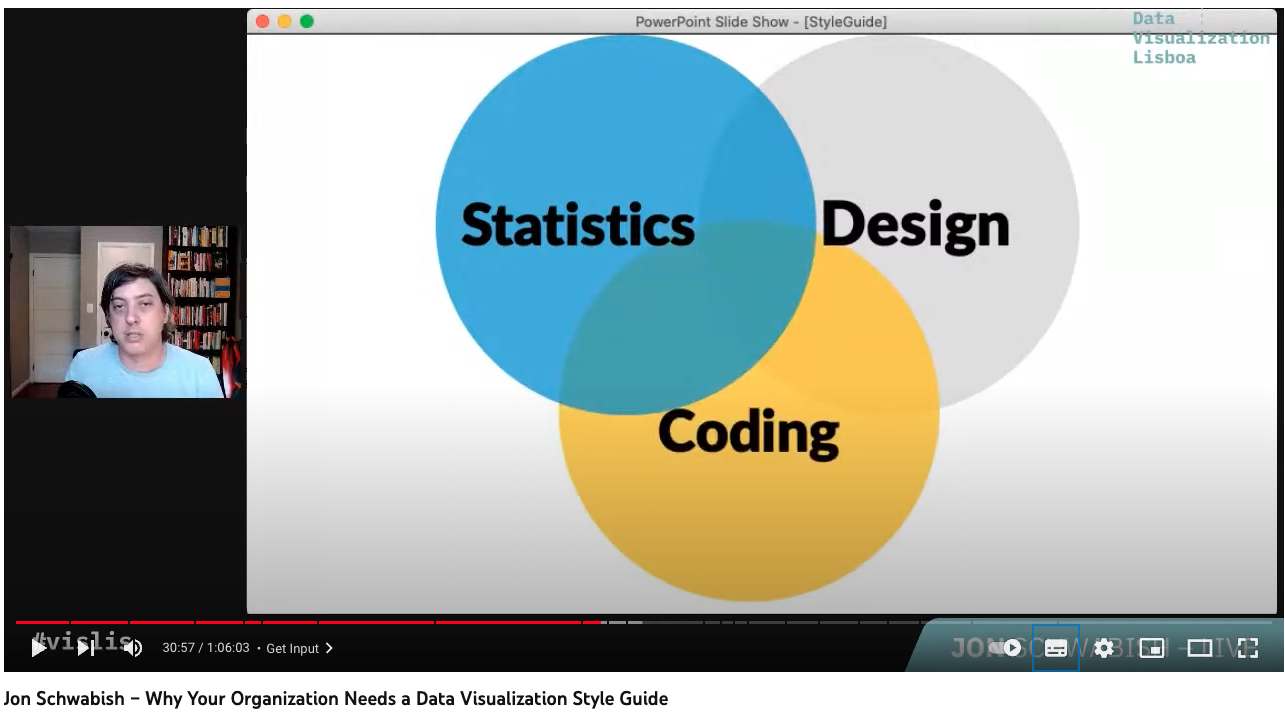
Skills to create a style guide
- statistics: data understanding
- design: not just make things pretty but also functional
- coding
Iterate and treat a style guide as a living document
Iterate and treat a style guide as a living document
Q and A
-
Make sure that you have some understanding about data. Data Visualisation is rooted in the data.
-
Is there any tool to put a style guideline in place within an organisation?
- for R vs Python vs Non-coder
- Github/web-based & pdf-based
After the guide is shared in the organisation, how do you follow up on it being used by everyone without becoming the “chart police”? (54:34)
Jon Schwabish How Urban Institute work: The process of a blog post:
- MS Words for text
- most of charts created by Excel
- the author <- talk -> blog editing team
- the author/research send text+charts
- Ask the data visualisation team to review the graph for the blog
- a discussion has to happen, eg pie chart with many slices
- The specific point of not becoming a chart police
- chart critique
- When you are critiquing a thing